Last month, October 15, 2013 around 8:12 am (Philippine Time), a magnitude 7.2 earthquake hit Bohol island, detroying several infrastructures and killing hundreds of residents. The Philippine Institute of Volcanology and Seismology or PhiVolcs recorded more than 3000 aftershocks, but only a fraction of these is available in their Earthquake Bulletin. There are 448 data points in total for last month's earthquakes, and here is the final output,
 Adding layer for two-dimensional density of the data points, we have
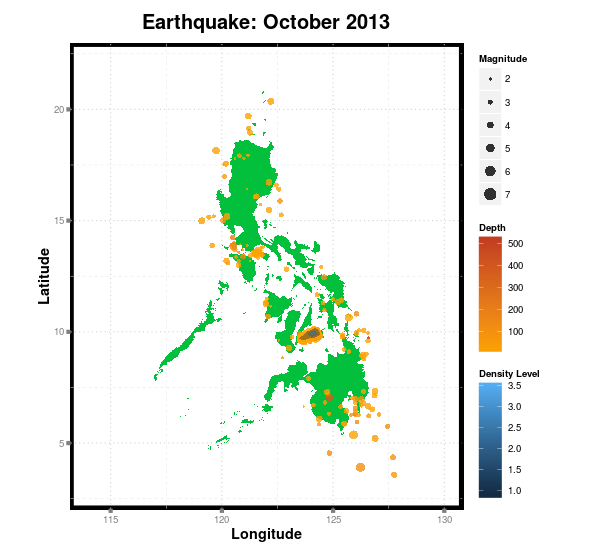 Clearly in the map, the peak of the density or say the bulk of the data points is in Bohol island. Just to give you an idea as to how many points overlapping the island, here are the 143 recorded earthquakes from September 2013. And as you can see, the points are very scattered, expanding the distribution.
 On the average, the magnitude of the earthquake is around 3.5 base on the histogram below, with density estimate close to Gaussian distribution.

 Salvacion (I hope that's his family name) made a map too for Bohol earthquake using base graphics in R. You might want to check his work.
Comments
Post a Comment